
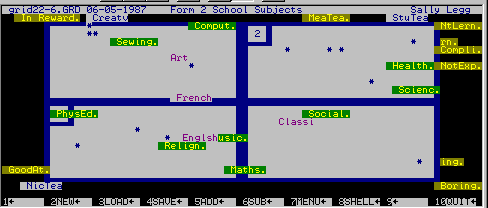
The next grid22-6.txt was her attitudes five months later. There are differences in the content namely French is new and Drama and Cooking are out. Later these subjects are "deleted" from each grid in order to use Consensus / Difference Analysis.
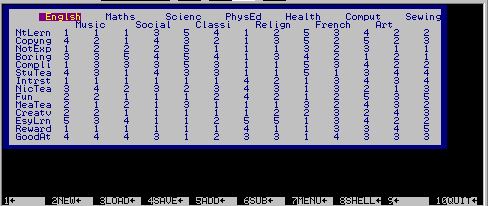
With the change in school year came a major change in the environment. The only teachers to teach the same subjects were in PhysEd and Science. Teachers from last year but teaching different subjects this year are in Social/Music; English/French.
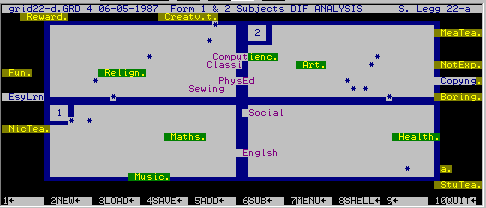
The grid22-d.txt Difference Analysis shows the extreme elements to be those which have changed by the greatest amount.
Health changed for Bad reasons Art changed for Bad reasons Religion changed for Good reasons Music changed for Good reasons . . .
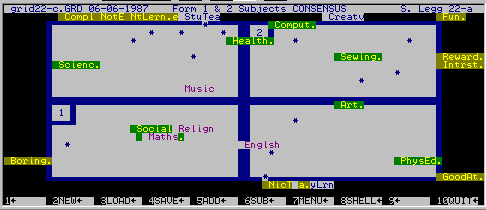
The Consensus grid22-c.txt shows the degree of consistency on the same attitudes being present over a period of time. What we do notice is the fact that Ingrid has "flipped" the screen. As stated before this does not lead to a different interpretation, it is simply a measure of the weight distribution between Top & Bottom; and Left & Right.
Please read the tutorial for a background to the above problem. I look forward to hearing from you.
Contact j.Maxwell Legg
mailto: income@ihug.co.nz